Oh, the seasons they grow! [research blog]

My latest clamuscript is published in Palaios, coauthored with my advisor Matthew Clapham! It’s the first chapter of my PhD thesis, and it’s titled “Identifying the Ticks of Bivalve Shell Clocks: Seasonal Growth in Relation to Temperature and Food Supply.” I thought I’d write a quick post describing why I tackled this project, what I did, what I found out, and what I think it means! Raw unformatted PDF of it here on my publication page.

Why I did this project:

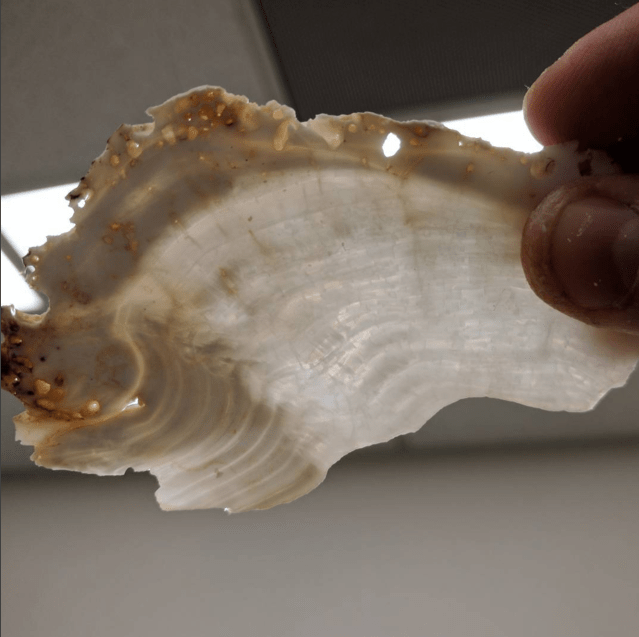
I study the growth bands of bivalve (“clam”) shells. Bivalves create light and dark shell growth bands as they grow their shells, much like the rings of a tree. The light bands form during happy times for the clam, when it is growing quickly and putting down lots of carbonate. The dark bands appear during times of cessation, when the bivalve ceases growth during a hibernation-like period. This can happen in the cold months, or the hot months, or both, or neither, depending on the clam and where it lives. It turns out that there are a lot of potential explanations for why these annual cessations of growth happen. Different researchers have suggested through the years that temperature (high or low) is the biggest control on the seasons that bivalves grow, but others have suggested that food supply is more important. Others say it’s mostly a function of the season they reproduce, when they’re putting most of their energy into making sperm/eggs and not growing their bodies. I wanted to try to see if I could find trends across all of bivalves which would shed light on which factors are important in determining their season of growth.

Capture.PNG
Annual growth lines in the shell of a giant clam. The transparent spots are the times that it was growing more slowly and not happy. Was this because of temperatures? Or was it getting less to eat? I wanted to know.

What I did:

I read a ton of papers in the historical literature about bivalves. These were written by people in many fields: aquaculture, marine ecology, paleoclimate researchers (using the clams shells as a chemical record of temperature), and more. All of the papers were united by describing the seasons that the bivalves grew, and the seasons that they stopped growing. I ended up with nearly 300 observations of marine (saltwater) bivalve growth for dozens of species from all around the world. I had papers as old as the earliest 1910s, and some as new as last year.

map.PNG
A map of all the places the observation of bivalve growth came from. Blue means they shut down in the winter, while red means they do not.

We have mussels, oysters, scallops, clams, cockles, geoducks, giant clams, razor clams, quahogs, and more in the database. Bivalves that burrow. Bivalves that sit on the surface of the sediment. Bivalves that stick onto rocks. Bivalves that can swim. With each, I noted data that the researchers recorded. If they grew during a season, I coded it as a 1. If they didn’t, I coded it as a 0. So a bivalve growing in summer but not winter would be recorded as 1,0. I also recorded environmental data including temperature of the location in winter and summer in the location, as well as seasonal supply of chlorophyll (a measure of phytoplankton, which is the main source of food for most clams). It turned out that not enough of the studies recorded temperature or chlorophyll for their sites, so I wanted to back these up with an additional data source. I downloaded satellite-based temperature and chlorophyll data for each location, as well as additional studies which directly measured chlorophyll at each site. I wanted lots of redundant environmental data to ensure that any trend or lack of trend I observed in my analysis was not due to a weakness of the data.

I then compared the occurrence of shutdown by season with these environmental variables using a statistical technique called regression. Regression basically involves trying to relate a predictor variable (in this case, latitude, temperature and chlorophyll during a certain season) to the response variable (did the clam grow in that season or not?). We wanted to see which environmental variable relates most closely to whether or not the clam grows or not. Because our dependent variable was binary (0 or 1), we used a technique called logistic regression, which tries to model the “log odds” of an event occurring in response to the predictor variable. That log odds can then be back-calculated to probability of the event occurring.

What we found:

shutdowns.PNG

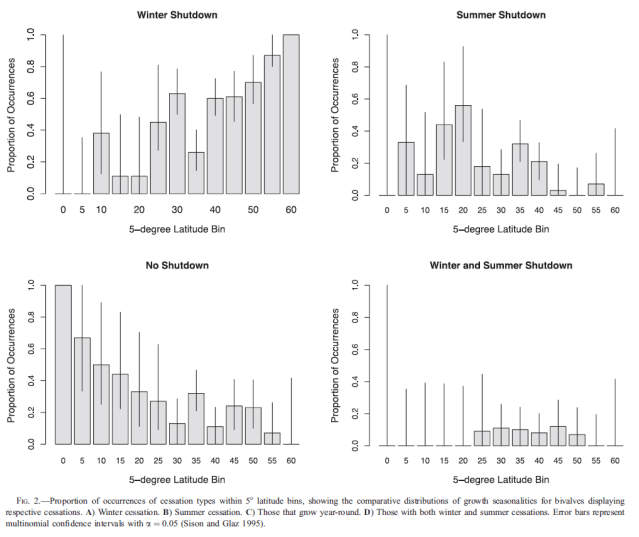
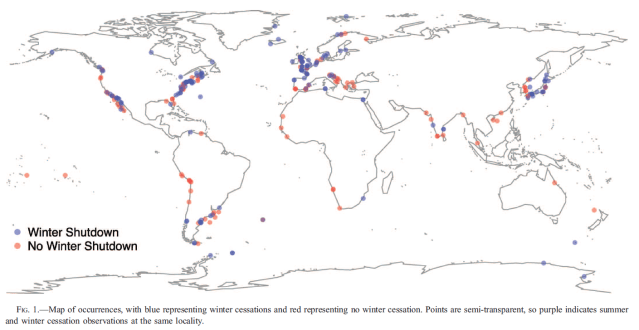
In a clamshell, we found that latitude (distance from the equator) is a very good predictor of whether or not a bivalve shuts down for the winter. As you’d expect, bivalves in the far north and far south of our planet are more likely to take a winter nap. However, bivalves at the equator mostly grow year round and are not likely to take a summer nap. In relation to temperature, the lower the winter temperature, the more likely the bivalve is to stop shell growth. High summer temperature is not as good a predictor for the occurrence of a summer shutdown, but the majority of summer shutdowns seem to occur at the low temperate latitudes, where the difference between the annual range of temperature is largest. Unlike at the equator, where bivalves likely can adapt to the hottest temperatures and be happy clams, they have to adapt to a huge range of temperatures in places like the American Gulf and Atlantic coasts, the Adriatic and Gulf of California. And if they are restricted at the northward end of their range, they may have no choice but to shut down in summer as there is nowhere cooler to migrate to.

Picture1
GIF of the satellite data showing white as hotspots of phytoplankton ability. Notice that the food is more available in summer months for each hemisphere. We were trying to see if this relates back to when the bivalves grow in every place we had data for.

Food supply, on the other hand, is not a good predictor of when bivalves shut down. When we went into this project, we expected food to be a powerful control on seasonal growth because it is intuitive and well understood that the better fed a bivalve is, the larger it will grow overall. But the seasonal low amount of chlorophyll (and therefore the amount of photosynthesizing plankton) in the bivalves’ areas had no relationship to whether or not the bivalve shut down in a certain season. To double check that this wasn’t a weakness in my satellite data, I downloaded additional direct observations from the same places as many bivalve studies in the dataset, but I still couldn’t find the relationship. We propose that the seasonal supply of phytoplankton is not well related to seasonal growth of bivalves because: 1) phytoplankton supply isn’t very seasonal in nature in most of the sites we studied. There are peaks in multiple seasons rather than a clean up and down wave shape like temperature. 2) Bivalves are pretty flexible in what they eat. They also eat other types of plankton and suspended particles that are even less seasonal. It may be pretty difficult to find bivalves that are seasonally starving. One of the most probable places to find such starvation shutdowns might be the poles, where seasonal ranges of temperature are quite small but plankton does really have a seasonal pattern of availability. More research will be needed to describe the nature of polar bivalves and why they shut down growth.

What’s next?
This is the first chapter of my PhD. I have two more chapters I’m working on, both related to the geochemistry of bivalve shells. I am writing those manuscripts this summer and looking for postdoctoral fellowships in the fall related to geochemistry of marine organisms in the fossil record. I hope to pursue more projects looking at the season of growth in bivalves, switching to understanding the role that changing seasonal cycles in their environment and biology play in their evolution. Do bivalves that live closer together tend to reproduce at different times? Can we track season of reproduction in relation to temperature and food supply? There are a lot more clam stories to be told and I look forward to sharing them all with you. Until the next research blog,

Dan


The insidious cost of increased class sizes: A TA’s perspective

UC Santa Cruz, like all UC schools, is in the midst of a massive regent-mandated effort to increase enrollment. In the face of a governor hostile to the idea of investing in education (despite his prior promises), the regents have decided that we are going to grow our way out of the budget shortfall. Much has been said about the foolishness of this plan from the standpoint of housing, student tuition and access to resources, but I thought I’d talk about the cost it has had on me personally as a Teaching Assistant (TA).

TAs are usually graduate students working on a doctorate or master’s degree. We are paid 50% wages on the assumption we spend 20 hours a week working on TA stuff to support our other 20 hours (ha!) of work a week on our thesis and classes. Our tuition is waived and we receive health benefits.

In the last two years, my department’s academic division has been cutting TAships while pressuring the department to enroll more students. For four years, I’ve been teaching the lab section for Environmental Geology (EART 20), which has given me a natural laboratory to note the impact that increased class size has had on my instruction. I’d also note that my experience has been less extreme than other TA’s because EART 20’s enrollment has been flat overall during the time I’ve taught. But the lab section has doubled in size from 22 to 45 students, possibly because we have more majors declaring and they need the lab credit for their degree.

Here are some ways my instruction has been impacted by doubling of students:

Grading time

As a TA, I am supposed to only spend 20 hours a week on instruction. I’m literally not allowed by my union to spend more time than that. And fortunately, because I have been able to slowly tweak my lesson plans over many years, I now have a lot less prep time than I did when I started teaching this class. The lesson plans are already put together, and I can just focus on polishing and perfecting the lessons. However, the time I need to grade has ballooned to at least double what it used to be. I say at least double, because I usually get tired after the 30th lab and start to slow down.

My detail in grading is also impacted because I cannot spend as much time looking and commenting on each student’s assignment. So while they’re paying higher tuition than their compatriots from four years ago, they are getting less instructor time dedicated to feedback on their work. Note that our department has tried to make up for this by hiring graders to assist TAs, but I insist on grading my own labs because I need to understand how students are learning and responding to my assigned material.

Less physical space for students

Our building used to have large, luxurious desks perfect for specimen-rich lab sections. But they unfortunately couldn’t fit more than 20 students in a room with those so they have put in smaller, flimsy desks to stuff more students in. These desks are narrow and crammed together to allow up to 30 students in the room. As a lab instructor, I prefer to walk around and answer student questions looking at the specimen we’re talking about until they understand and have that light-bulb moment. But I can’t do that anymore because the desks are so close together. So instead I now sit at the front of the room and they come up to me. I hate this and I know I get less questions than I would if I could walk around. It is another way that they aren’t getting their money’s worth.

Less interactivity

The UC claims to be a big cheerleader for the active learning style of teaching. Active learning is different than the classic lecture-based format in that exercises are designed to maximize student participation and interactivity between the student and instructor, hopefully leading to learning by experience rather than example. But active learning requires more grading time and a different classroom layout than the classic lecture format. And I have had to revise my labs over the years to reduce interactivity out of necessity. In the past, I’ve made a landscape out of play-dough for students to map out topographic profiles. This year, there were just too many students for it to work. They scrunched together around the model, with some deciding to wait until my office hours to get time doing it. It was sad to watch this. Next time, I’ll make two models to space through the room so it isn’t so claustrophobic.

Take-away

These problems are only going to get worse, as our department is currently under pressure to increase enrollment and has less TAships to offer every year. We are often criticized for our low student to instructor ratio! Yet tuition is increasing. Students are getting less value for the same course offered four years ago. I’ve observed it with my own eyes. I feel a pang of sadness each lab section seeing the ways it reduces the quality of instruction. I spend more time to try to lessen the impact of these creeping changes, but something’s got to give. I hope Californians realize that the value of our legendary UC schools is under attack. I hope we invest more into education and don’t forget that the UCs helped make our state great. I hope Jerry Brown cements his legacy by increasing UC funding.


Things I wish I knew/did earlier in grad school

  • Keep a journal of every research-related idea you have and every research-related action you take. Seriously, find the most frictionless way you can keep notes and stick to it. Your brain will thank you later.
  • Ask for help whenever possible, but with the knowledge that many of the issues you have will have no troubleshooting manual.
  • Crude, hacked together and done is better than perfect and never finished.
  • Work when you feel productive. Sleep when you feel less productive. Use the benefits of being a self-scheduled researcher to your advantage.
  • Don’t feel guilty to be involved in grad student life and service. These activities give a mission and direction to your research.
  • Take on a mentee. It is such a massive boost to your own productivity to take charge of managing and encouraging another less experienced person’s work. It will push you to practice what you preach.
  • Make sure your family and loved ones know what you do and what is expected of you, so they aren’t upset when you aren’t free to talk or have to work a late night.
  • Don’t hold on to the paper you’re working on too long. Chances are that there is someone out there doing a similar project based on an idea that they had at the same time as you, and you don’t want to get scooped.
  • If someone more experienced than you who you respect disagrees with your findings, that doesn’t mean you’re wrong.
  • Don’t be afraid to overhaul a project you have based on new information. This is the stage of your career when you are not invested in a theory or particular method. You can quickly change tack to use new analyses and pursue new research questions with little or no cost. Your committee will understand.
  • NEVER show off how much you work. We all work a ton (yes, you do too, don’t let that impostor syndrome get you) and there is no need to hero-worship based on how many hours we work a week.