Research Explainer: How giant clams record their diet in their shells

Two giant clams near Eilat in the Northern Red Sea. To the left is the small giant clam, Tridacna maxima, and to the right is a mature individual of the rare endemic giant clam Tridacna squamosina, only found in the Northern Red Sea.

You are what you eat, and clams are too. We’re made of atoms, which come in “flavors” called isotopes, relating back to the mass of the atoms themselves (how many protons and neutrons they have). Nitrogen, for example, comes in two stable (non-radioactive) forms called nitrogen-14 and nitrogen-15. Much like scientists can track the composition of a person’s diet from the isotopes of their hair, researchers have used the isotopes of clams to figure out their diet.

Nitrogen isotopes provide us with a useful and detailed record of food webs. Plants and algae tend to have more of the light isotope of nitrogen in their tissues than the animals that eat them (primary consumers), and the animals that eat those animals have even higher nitrogen isotope values. We can measure the amount of “heavy” atoms of nitrogen with a unit called δ¹⁵N (“delta 15 N”). A carnivore at the top of the food chain will have a very high δ¹⁵N, while plants will be the lowest. Clams, typically being filter feeders, will usually have an intermediate value, since they’re eating a lot of phytoplankton (tiny microscopic floating algae) and zooplankton (animal plankton that eat other plankton).

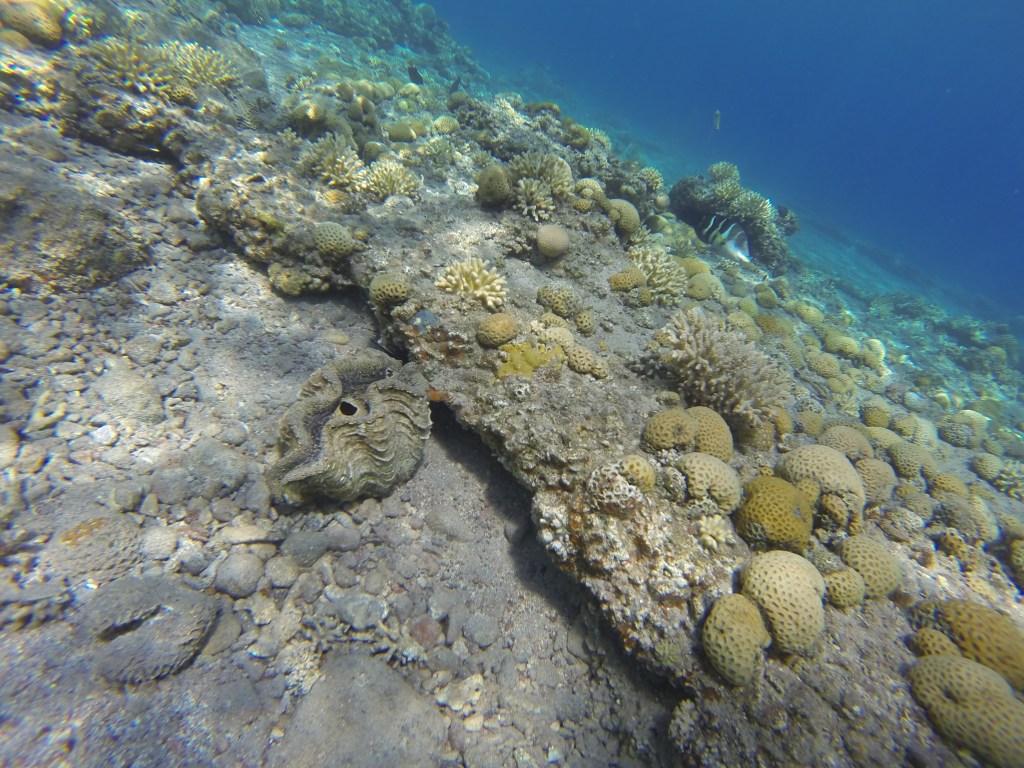
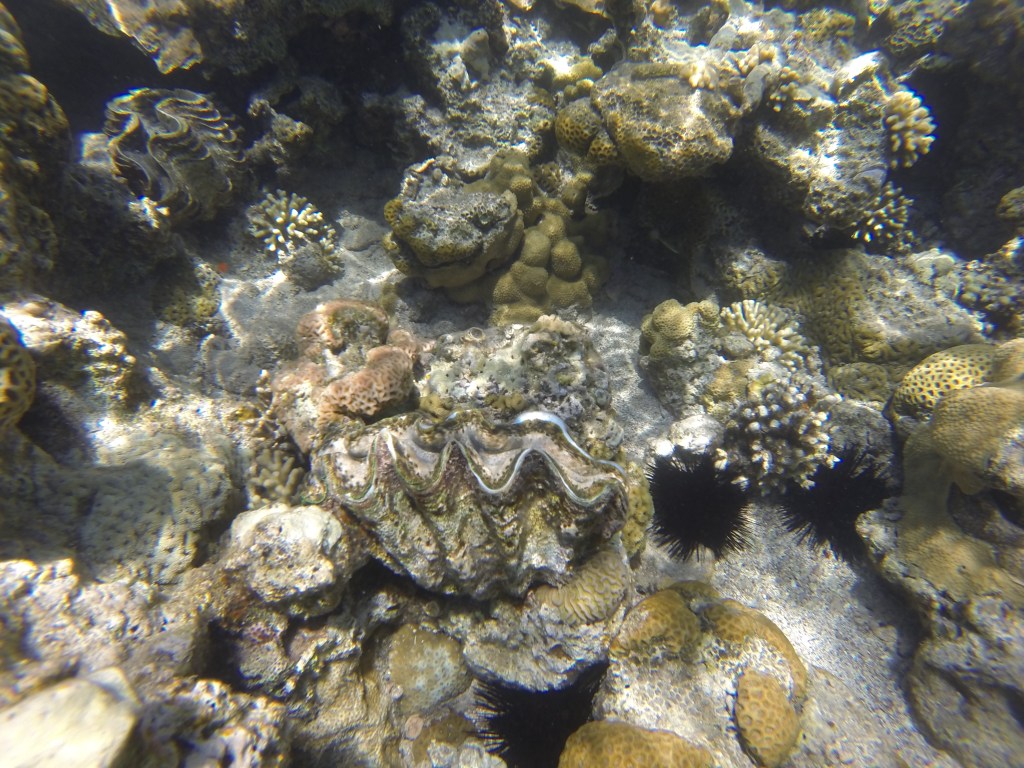
But I study a special kind of clam, the giant clams, which have a cheat code enabling them to become giant: they have algae *inside* of their bodies. The algae make food using photosynthesis and share it with their hosts! In exchange, the clams provide the algae with a stable environment free of predators, plenty of fertilizer in the form of their own waste, and even channel extra light to help the symbionts grow faster. This partnership is called photosymbiosis, and is pretty rare in clams, though it is common in other animals like the corals that build the reefs where giant clams are found! Previous researchers have shown that giant clams have very low nitrogen isotopic values in their tissue, like a plant, because they get most of their nutrition from the algae, rather than filter feeding.

I am a sclerochronologist. That means I study the hard parts of animals, in this case the shells of bivalves. Like the rings of tree, bivalves make growth lines in their shells which can serve as a diary of their lives. Some of my past work has looked at using chemistry of the growth lines of giant clams to measure the temperatures they grow at, compare the growth of ancient and modern clams, and even look at how much the clams grow in a day! Today though, I’m talking about my most recent paper, which looks at how we can use the shells of giant clams as a food diary.

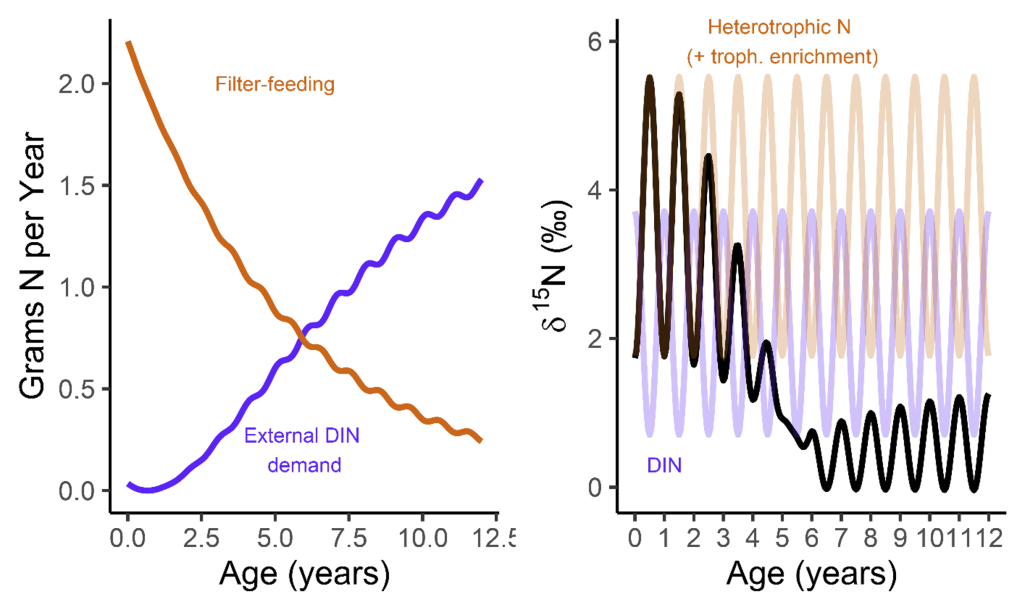
But when they’re babies, the symbiosis in giant clams is not yet fully developed. During this early period of their lives, giant clams actually get more of their nutrition from filter-feeding like a “normal” non-photosymbiotic clam, until they’ve had a chance to grow in surface area and become a living solar panel. Like all bivalves, the shells of giant clams are made of calcium carbonate, bound together by a protein scaffold we call the shell organic matrix. Proteins are made of amino acids, which contain nitrogen! If we can get the nitrogen out of the shell from the early part of the clam’s life, and compare it to the nitrogen at the end of the clam’s life, it might record the clam’s transition from filter feeding to its mature plant-like lifestyle! If our hypothesis holds, we should record a decrease through its life in the shell δ¹⁵N values.

A model I made of the clams’ nitrogen intake, with the left plot how they switch from filter feeding to getting most of their nitrogen from dissolved sources around 5-6 years of age. Because the nitrogen isotopes of those two sources are different, that manifests in the expected values from the clam’s body (the right plot)!
A map made by my talented partner, Dana Shultz!

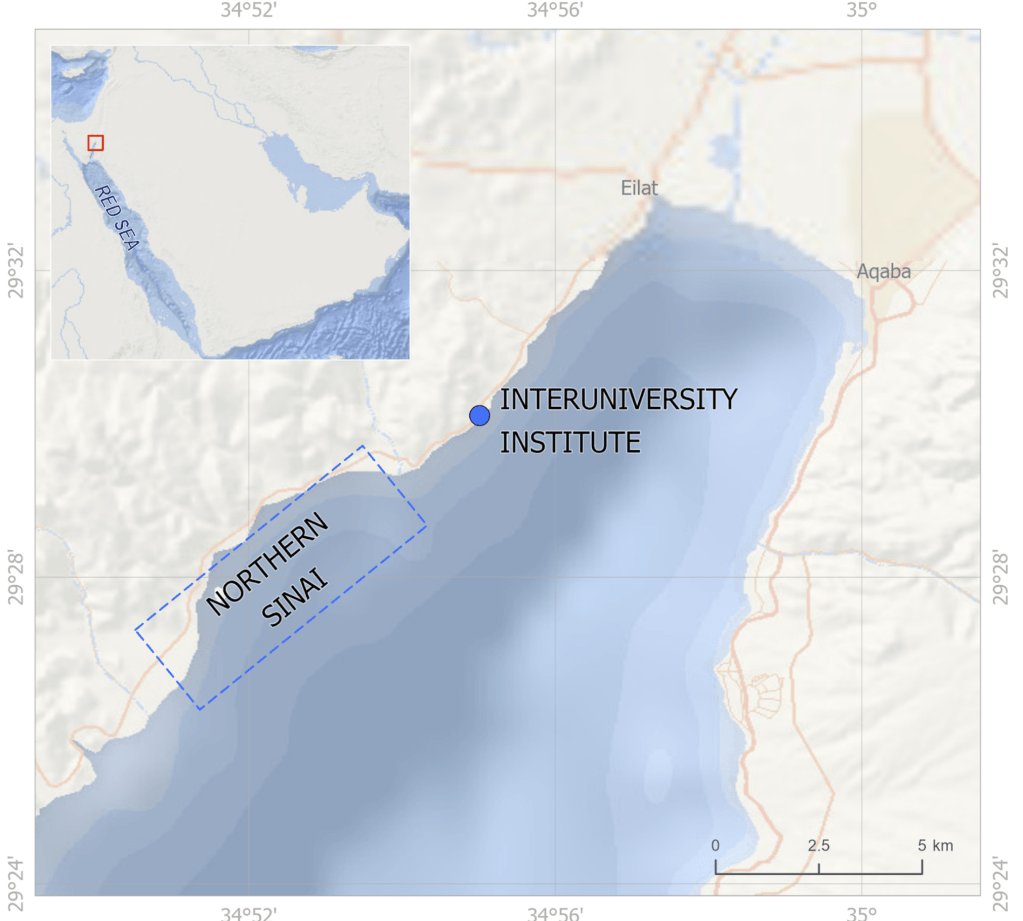
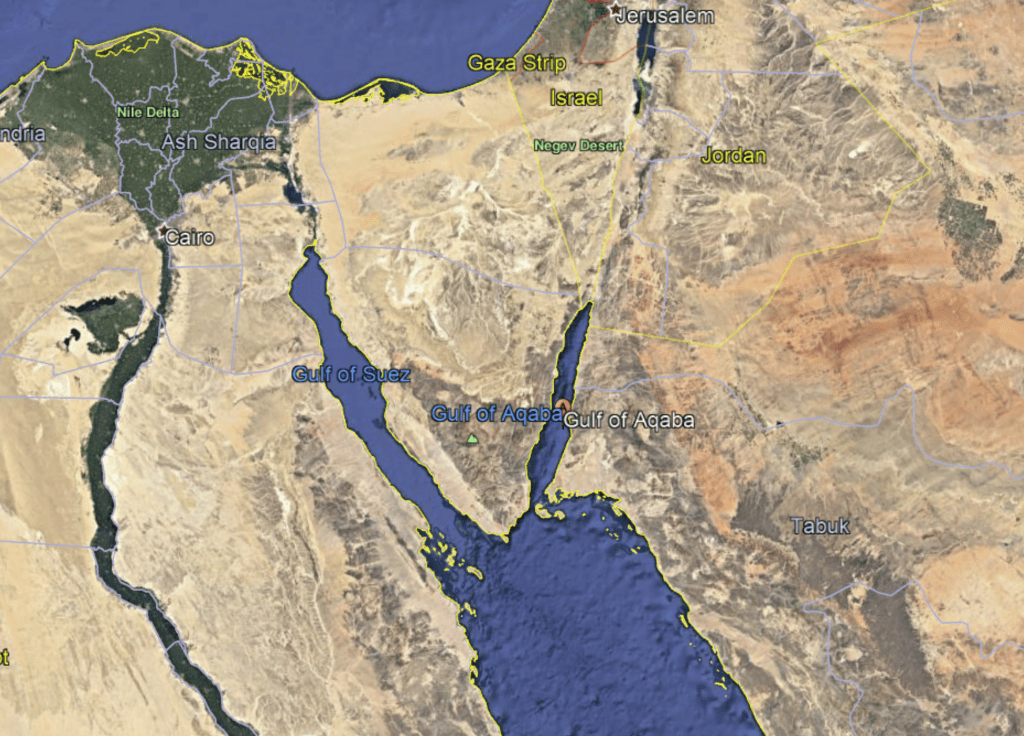
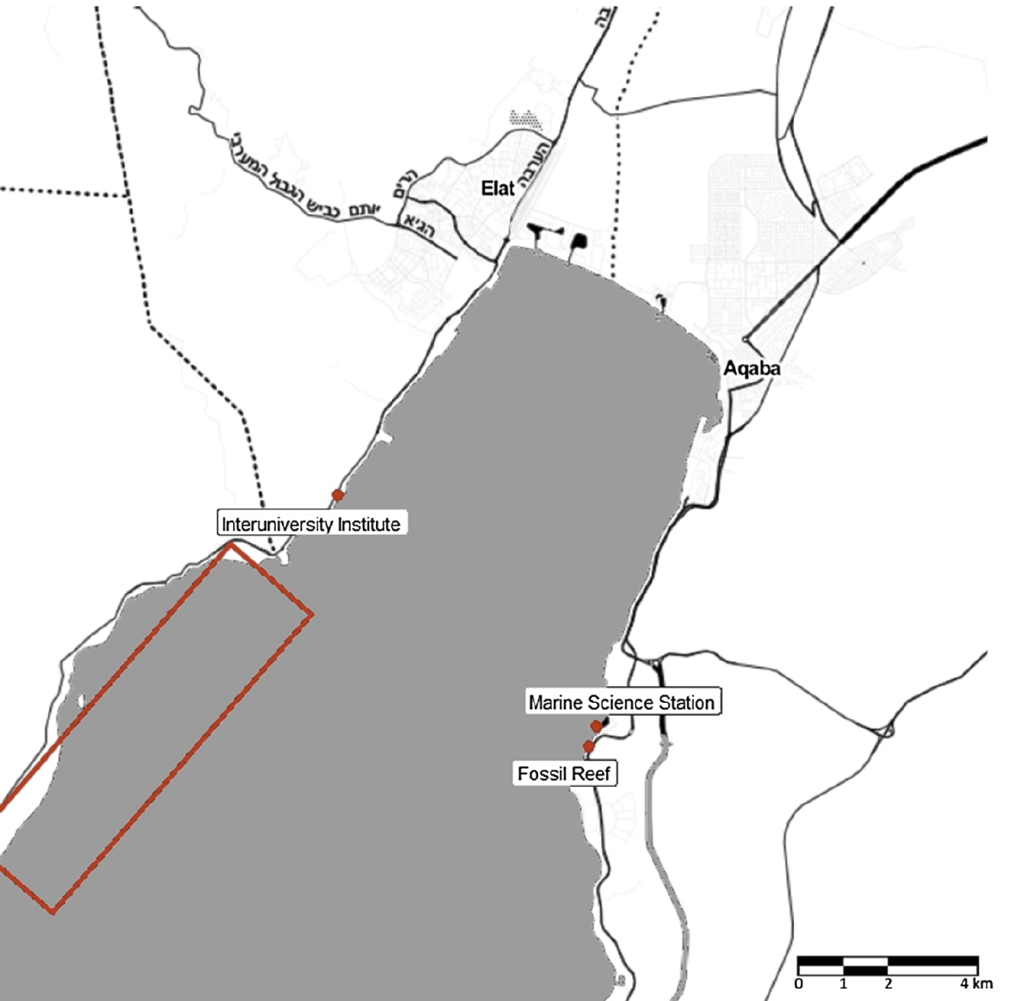
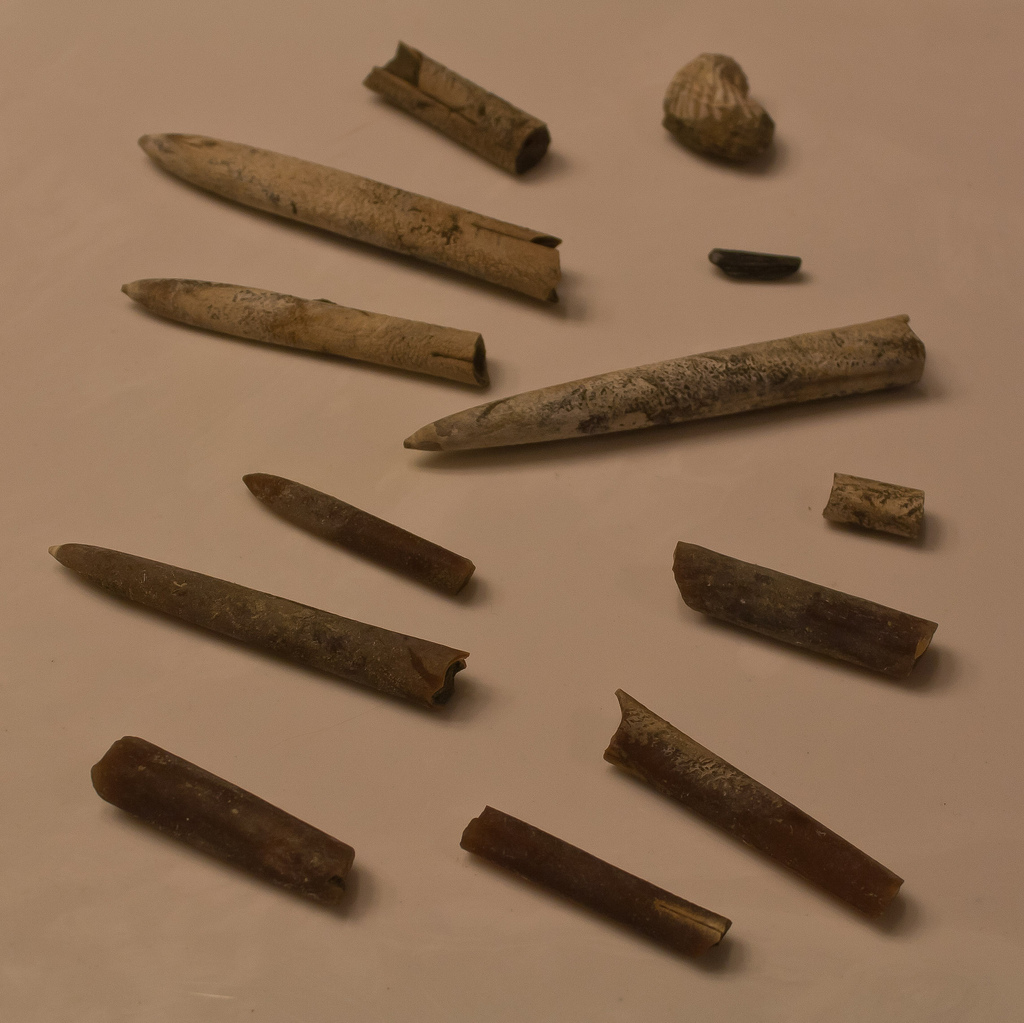
So I gathered a team of talented collaborators and set out to test that hypothesis, using giant clam shells that I was able to get on loan from the Hebrew University of Jerusalem Museum. These shells had been confiscated from poachers at the Egypt-Israel border. While I would have rather known these clams were still alive in the waters of the Northern Red Sea, being able to use them for research to understand the biology of their species was the next best thing! I had originally planned on pursuing a postdoc undertaking this project with Rowan Martindale, a professor at UT Austin who has studied the nitrogen isotopes of photosymbiotic corals, but when I started up at Biosphere 2, we ended up continuing with the project anyway as a collaboration! We measured the nitrogen isotopes of the shell material in the lab of Christopher Junium, a professor at Syracuse University, who has developed an exquisitely sensitive method to measure the nitrogen from shell material by essentially burning the shell powder and then scrubbing out unwanted material to isolate the nitrogen, to measure the isotopes in a machine called a mass spectrometer. Katelyn Gray is a specialist in isotopes of biominerals and assisted with drilling out powder from the shells with a Dremel. Shibajyoti Das, now at NOAA, is a specialist in measuring the shell nitrogen isotopes of other bivalves and he was master at doing much of the mass spectrometer work, and assisting in interpretation. Adina Paytan is a professor at UC Santa Cruz. She first provided the funding and support for me to go to the Gulf of Aqaba and collect these shells as part of an NSF-funded student research expedition! She also provided environmental data which helped us to interpret what the clams were actually eating!

A figure showing the four shells we sampled from, with the sampling areas in each hinge area showing colored and matching with the corresponding isotope plot to the right (colored points). 3 of the 4 shells show declines in isotope values with age. Shaded ribbon behind the data shows the model output.

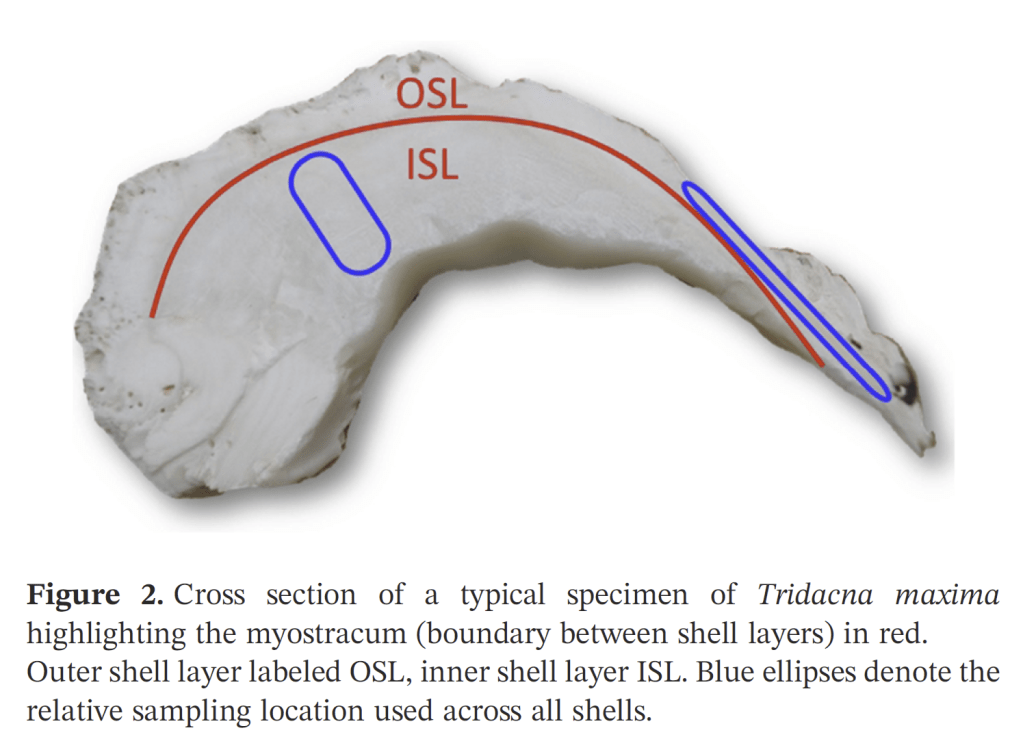
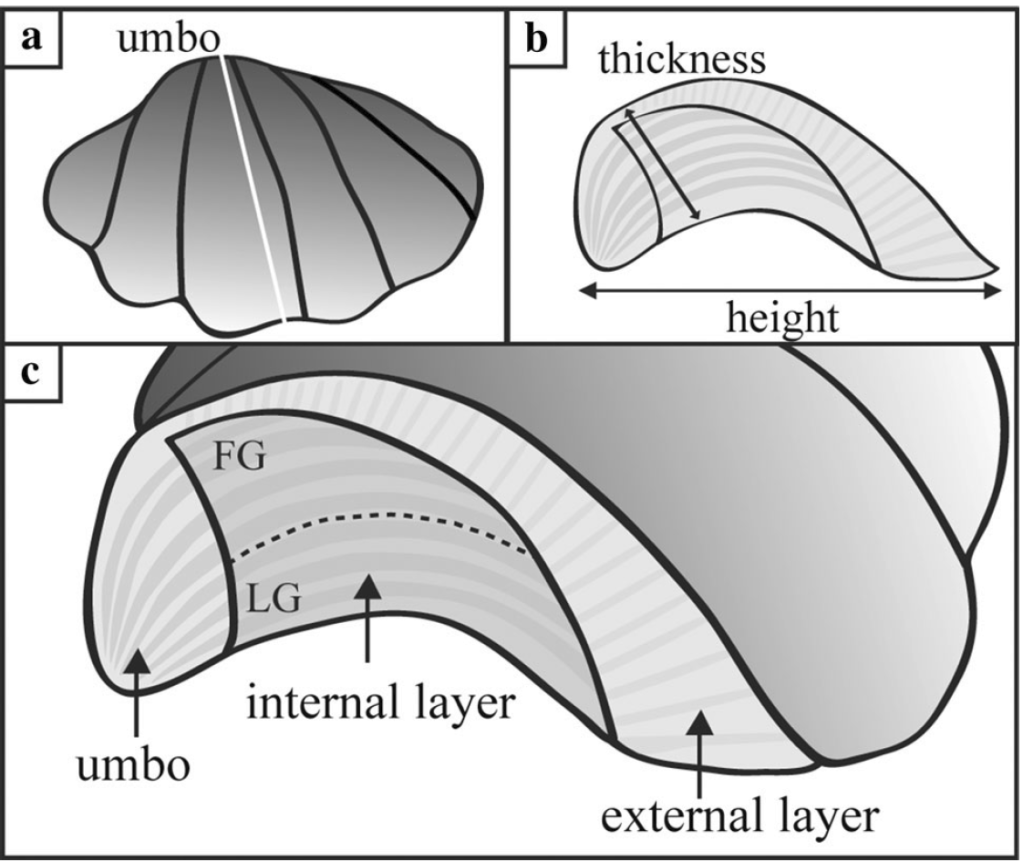
So what did our crack team of scientists find out? We found that three of the four tested giant clams did indeed measure a decline in nitrogen isotopes over the course of their lives. Their earliest growth lines in the hinge areas of their shells record elevated δ¹⁵N values similar to other filter-feeders from the region. But as they aged, their later growth lines show much lower δ¹⁵N values, more like photosymbiotic corals and plants from the region. So clams indeed recorded the transition in nutrition as they became solar-powered! This degree and directionality of change in nitrogen isotopes was much greater than has been observed in any other clams measured in this way, which made sense considering their unique physiology. The clams have another area of the shell, the outer shell layer, which is closer to the symbionts than the hinge area. In this outer shell area, we did not observe much of a consistent trend in nitrogen isotopes. It’s likely that the outer layer is highly influenced by the photosymbionts even at the earliest stages of life.

Growth lines in the hinge area of two of the shells lit from behind, with the drilled areas for this study visible as well. The outer shell layer is the opaque and was also sampled for this study.

There was one clam that differed from the others in showing low δ¹⁵N values through life in its hinge shell layer. To help explain these differences, I created an independent model of the clams’ internal chemistry based on their growth rate, which slows as they age, and also is faster in the summer. When the clams are young filter feeders, they get most of their nitrogen from plankton, debris and other material floating in the water column making up floating material we call Particulate Organic Matter (POM). Meanwhile, when they are in their photosynthetic life stage, they get most of their nitrogen from nitrate, which is essentially Miracle Gro for the symbionts. The model showed that the clams should record a flip from filter feeding to photosynthesis around 4-5 years of age, which was confirmed by three of the shells! But what about the one that didn’t show this trend? My colleague Adina had fortunately measured the isotopes of POM and nitrate in different seasons in the Gulf of Aqaba. We found that in summer, as expected, POM δ¹⁵N is lower than nitrate. In the winter, meanwhile, that relationship is flipped! So if a clam grew more in winter, it would not record the same transition as was seen by the other clams. We think the clam that was the exception to the rule might have been more of a winter grower.

The chaotic nutrient environment of the Northern Red Sea, showing how in different seasons, dissolved nitrate has higher or lower δ¹⁵N values than the Particulate Organic Matter that the clams filter-feed on.

But long story short, we were able to demonstrate for the first time that giant clams show nitrogen isotopic values in their shells in line with expectations from their diet. Other clams have been measured this way, but the fact that we were able to conduct these analyses at all is a testament to the sensitivity of the elemental analyzer in Chris’s lab. Giant clams have *very* low concentrations of organic matter in their shells, so the forward march of technology was a major factor enabling this study to be possible.

Why does it matter that we can measure the transition of the clams from filter-feeding to photosymbiotic in their shell records? Well, giant clams are not the only bivalves which have photosymbionts. There are other clams in the fossil record which have been proposed to have had symbioses with algae, but until now we’ve never had a definitive geochemical way to measure this in fossils. We hope that this approach can be applied to the organic material in fossil shells, which is often well preserved, to see if huge clams in the Cretaceous and Jurassic had a similar way of life to the modern giant clams! If we can demonstrate that was the case, we can see how such species responded to past intervals of climate change, which will help us understand how giant clams will fare in the warming, acidifying ocean of the present.

These results also help explain the lives of giant clams themselves. We hope this kind of data can be used to measure the symbiotic development of giant clams in different places, with different types of food and nitrogen available, where we’d have the potential to measure pollution. Interestingly, the time that the model shows the clams transitioning to photosynthetic maturity is right around the time that they reach reproductive maturity (5-10 years of age). We’d like to investigate whether the time of clam maturity is controlled by the development of their symbiosis, which itself might relate to nutrients in the clams’ environment. If clams can grow faster, then they can mature faster, and potentially reproduce sooner in life. Will giant clams be able to thrive in the presence of increased nitrate, which is a common pollutant in coral reef environments? Like all worthwhile research projects, we have dozens of new questions to pursue as a result of this work, so stay tuned for the next installment in this journey of clam knowledge!

Research Explainer: The chemistry across a “forest” of giant clams

T. squamosa near Eilat, Israel, 2016

Another one of my PhD chapters is published in the journal G-cubed, resulting from work I did in the summer of 2016 in Israel and Jordan around the Red Sea. This is my first geochemistry article in a journal, so it is a big deal to me! I thought I’d write up a clamsplainer about what I was looking for and how we went about achieving the paper.

A slice of giant clam shell. You can see the difference between the inner and outer layers. The inner layer has visible annual growth lines.

I study the chemistry of giant clam shells. You might already be familiar with the concept of tree rings, a field called dendrochronology. It’s like reading the diary of a tree, where every “ring” is a page in the record of its life. The related field of sclerochronology looks at rings in the hard parts of shelled organisms. We can count those rings to figure out the ages of clams, or their health, and we can measure the chemistry of those rings to understand the temperature the clam grew at, and even what it ate.

A giant clam growing on the reef flat in Eilat

Giant clams are bivalves of unusually large size which achieve a very rapid growth rate through the help of symbiotic algae in their flesh. The clams are farmers, and their crop is inside their tissue! They grow their shells very quickly (sometimes up to 5 cm a year, equivalent to if a six foot tall man grew a foot every year from birth), and live a very long time, up to 100 years (their growth slows later in life). A whole bunch of talented researchers have measured the chemistry of giant clams all around the world to reconstruct past climate and even measure historic storms!

If we want to understand the ecology of a forest, we can’t measure just one tree!

But if you come back to the analogy of tree rings, we essentially have measured the rings and chemistry of individual “trees” in a bunch of different places, but don’t have as good an idea of how the chemistry varies within a “forest” of giant clams in a particular place. In our new study, we set out to describe exactly that, focusing on the Northern Red Sea.

A map of the Northern Red Sea. The right “toe” is the Gulf of Aqaba
Sites where we sampled shells along the northernmost tip of the Gulf of Aqaba

The Gulf of Aqaba represents the northernmost toe of the Red Sea, bordered by Egypt, Israel, Jordan and Saudi Arabia. It hosts some of the northernmost coral reefs in the world, aided by tropical temperatures and clear waters due to the lack of rainfall in the surrounding deserts. Here, we can find three species of giant clams including the small giant clam Tridacna maxima, the fluted giant clam T. squamosa and the very rare T. squamosina, which is found only in the Red Sea and nowhere else (as far as we know). In summer 2016, I went all around the Gulf of Aqaba collecting shells of clams from the beaches, fossil deposits, and even were able to work with shells confiscated from smugglers at the Israel-Egypt border. We cut these shells into slices and used tiny drill bits to sample powder from the cross section of their shells, which we could then conduct geochemistry with! We sampled large areas in bulk from the inner and outer portions of the shell (more on why later) using a Dremel tool, and also sampled more finely in sequential rows with a tiny dental drill bit (same brand your dentist uses!) to see how the measured temperatures varied through seasons. By “we”, I mean my coauthor and friend Ryan Thomas, who spent every Friday morning for several weeks milling out most of the powder we needed for this study. This data became part of his senior thesis at UCSC!

Two giant clams thriving on the shallow reef near Eilat, Israel

What kind of chemistry did we measure? The shells of clams are made of calcium carbonate, the same stuff Tums is made of. Calcium carbonate contains one calcium atom, one carbon atom, and three oxygen atoms. It turns out that all of those atoms come in “flavors” that we call isotopes, relating to the weight of those atoms. When you take the shell powder and put it into a machine called a mass spectrometer, you can figure out the proportions of isotopes of different elements present in the samples

The first isotope “flavors” we were interested were carbon-12 and carbon-13. The ratio of the two is thought to relate back mostly to the action of the algae inside (its symbionts) and outside the clam’s body (the floating algae the clam filters out of the water as an additional meal). This happens because as algae take carbon from the environment and bind it into sugars through photosynthesis, they naturally weight the dice in favor of carbon-12 making it into the sugars. So carbon-13 is left out in the water, and potentially in the clam’s shell. When photosynthesis is more active, it would leave the shell with proportionally more carbon-13. At least that’s what other researchers have confirmed happens in corals, and suspect happens in clams. In the world of isotope chemistry, this phenomenon is called “fractionation,” when a process causes isotopes to form fractions separated by mass. We wanted to test if that was true for giant clams, and could do so by comparing T. squamosina and T. maxima, which have more active photosynthesis, to the less photosynthetic T. squamosa.

Comparing carbon isotopes across different species and shell layers. The results are fairly flat all the way across.

It turns out that the more symbiotic species don’t have more carbon-13 in their shells. We set out several reasons that might be the case, including that the symbionts of these clams are actually more carbon-limited than many researchers might expect. Essentially, the algae lack an excess of carbon atoms to choose from, so they can’t be picky with which isotopes they use to make sugars. Therefore, the fractionation effect weakens and becomes possibly too subtle to manifest in the shell, even in the best-case scenario of three closely related species living the same area. This represents what I’d term a “null result.” We had a hypothesis and we demonstrated that hypothesis was not the case in our data. It was important to publish this result, because other researchers will know not to try the same thing. This means that when we try to search for evidence of symbiotic algae in fossil clams, we will likely need to use other types of chemistry to figure it out. But don’t worry, as finding such a “smoking gun” for algal symbiosis in fossil bivalves is part of my life’s work! I have a few projects in the works looking for exactly that kind of evidence! 😉

A look at how temperatures measured via oxygen isotopes vary through the lives of the animals. This is how scientists can use very old shells to figure out how temperatures varied through a year in prehistoric times!

But we had additional data we collected in addition to the carbon isotopes which actually turned out to provide some interesting results. This other type of measurement regarded the oxygen isotope ratio of the shells. Previous research has shown that the ratio of oxygen-18 to oxygen-16 in carbonate skeletons directly relates to temperature, a principle that has birthed a field known as paleothermometry. There are thousands of papers which use shells of corals, clams, cephalopods, microbes and more to reconstruct temperatures in ancient times. Giant clams have proven to be effective weather stations going all the way back to the Miocene epoch, millions of years ago! Because they grow so quickly (putting down a new layer every day), live for a long time, and don’t stop growing, they form very complete, high-resolution, and long records of past climate.

But no past studies had ever compared different species of giant clams from the same place. There would be interesting new lessons to draw from such a comparison, including seeing if one species preferred to grow at warmer parts of the reef. As complex, three dimensional structures, there are many remarkably different micro-environments throughout a reef, from the hot, sun-exposed reef flat and crest to the cooler, current-swept, deeper fore-reef. Do any of the species of giant clams show a consistently higher temperature than the others, and what would that mean if they did?

T. squamosina records higher temperatures than the other species. Outer shell layers also record higher temperatures than inner shell layers. More on that later in the post 😀

It turns out that the rare T. squamosina, only found in the Red Sea, does record a higher average temperature, almost 3 degrees C higher than the other two species. This is of interest because this species had been proposed by prior researchers to only live on the sun-drenched reef crest, at the shallowest part of the reef. We believe these results corroborate that observation. The previous research on the habitat of T. squamosina was limited to a single study which only was able to find 13 live animals along the coast of the Red Sea. But by independently confirming this life habit, we can ask further questions that may be borne out by further research.

An example of T. squamosina showing signs of possible bleaching (light parts at the center of its body).

Being restricted to the shallowest waters, is T. squamosina at greater risk of harvesting by humans along the shores of the region than its counterparts? Illegal poaching of giant clams along the Red Sea is believed to be a major stressor on their population size in the area. Could this explain why T. squamosina is so rare today, despite being proposed to have been more common in the past? In addition, being restricted to the top few feet of depth in the water could leave the species more vulnerable than the others to atmospheric warming. As with corals, when giant clams overheat they will “bleach”, expelling their symbiotic algae as a stress response. While the clams can recover, it is sometimes a fatal form of stress that leads to their death.

An excellent cartoon of the different shell layers in giant clams. From a peer of mine who also studies them, Michelle Gannon!

More research is needed to answer those questions. But the last aspect of this study relates to what is happening inside of the bodies and shells of the clams themselves. Giant clam shells have two layers. The outer layer grows forward away from the hinge, increasing clam’s length. The clam also makes an internal layer, growing inward to thicken the shell and add weight. We can read the growth lines of the clam’s diary within either layer, and different studies have used one or the other to make records of climate change. But very few studies have compared the two layers of the same individual. Do they record the same temperatures? Figuring it out would be important to determine how studies with just the inner layer or outer layer can be compared to each other across time and space.

A vividly blue example of the small giant clam, T. maxima. From user arthur_chapman on iNaturalist

In our studied clams, it turns out that the outer layer records warmer temperatures on average than the inner one! After ruling out other possible explanations behind this difference (the details are complicated and hard for even shell nerds to wrap our heads around), we settled on the idea that the outside of the clam is indeed warmer on average than the inside! This means that the outer layer, recording temperatures of the outer mantle, is indeed forming at a higher temperature than inside! Why is this?

Unlike us, clams are ectothermic. They generally stay the same temperature as their surrounding environment and don’t use their metabolism to generate internal heat. But that doesn’t mean that the clam doesn’t have hotter and cooler spots in its body. It makes sense that it would be hotter at the outer part of its body, facing the sun, as the solar rays hitting its outer mantle would then radiate out again as heat. The outer mantle is also darker in color than the inner mantle, allowing it to absorb more solar energy, much as you might feel hotter wearing a darker t-shirt in the sun than a white one. Photosynthesis itself produces a warming effect, a phenomenon known as non-photochemical quenching, and so the outer mantle, which contains the vast majority of the symbiotic algae, may be partially warmed by the activity of the symbionts!

More research is needed to confirm if this is true. As of yet, no researcher has ever stuck a temperature probe in multiple parts of a clam to see if the outside of it is indeed warmer than the inside. But until that day, it is interesting to think of how this would influence comparisons of diaries from the inner and outer layers of different bivalves. The effect is on the small side, so it doesn’t really mean one layer or the other should be preferred for future shell-based studies of climate change. But it could be an additional aspect to consider in the future as a way to record temperature differences within the body of an animal, and look into how those differences influence its overall level of stress.

Examples of juvenile smooth giant clams, T. derasa, that we’re growing at Biosphere 2. Photo by Katie Morgan.

So I hope this long explanation of my paper helps you to have a better idea of the work I did during my PhD thesis. There were other aspects to the paper that are too wonkish to get into here, particularly concerning the correlation we found between carbon and oxygen isotope ratios, but if you have questions or want a copy of the PDF, please message me! I have more clam papers in the pipeline, and my new postdoc at Biosphere 2 involves growing three species of giant clams in a controlled environment, where I hope to answer some of the physiological questions I mentioned above! But until then, stay hinged and happy as a clam (as much is possible in this chaotic time), and take comfort knowing there are colorful bivalves out there all at this very moment, harvesting sunlight for food and growing huge shells.

You are Isotopes (Part III)

This is the third part of a series about isotopes and why they’re useful and interesting to scientists.

Isotopes are the flavors of elements. And because our universe is made up of atoms of elements, every object can be thought of as a delicious smoothie of flavors. Scientists like me are trying to reverse engineer those mixtures and pick out individual tastes, in order to answer questions about our world.

For example, I work with giant clams. These guys build enormous shells made of a mineral called calcium carbonate: CaCO3. That means that every molecule in a clam’s shell contains a calcium atom, a carbon and three oxygens. But as you might know from reading the previous entries in this series, not all of those atoms are the same. They are a mixture of different flavors. We have some carbon-12 and 13 in there (so named for their atomic weights), and some oxygen-16, 17 and 18. Here I’m focusing on the stable isotopes, which are not radioactive and are called “stable” because they’re not going to self-destruct. There are radioactive isotopes in there too, but I don’t use those nearly as often in my work.

calcium-carbonate-powder-1291396
Officer, this is a pile of giant clam powder, I swear!

I am measuring stable isotopes of carbon and oxygen in my shell samples. To do this, I take a sample of powder, grind it up, weigh it, and put it into tiny little cups. We only need a very small sample: about 50 micrograms of shell material. A typical pill of tylenol contains over 300 mg of active ingredient, so about 6,000 of my samples will fit in a single tylenol regular strength pill, if you suddenly decided you needed a giant clam prescription.

deflect
Simplified representation of what’s happening in a mass spec. Source

This tiny sample is one of thirty that I can measure at a time. Those samples are reacted with acid and the CO2 gas that is released as a result of the reaction can be processed by a machine called a mass spectrometer. The mass spec, which is in the Stable Isotope Laboratory in my building, ionizes the molecules in that gas (gives them a bit of electric charge) and then those ions are flung through an electromagnetic field. That beam of charged gas is flung around a curve. That curve is where the magic of making a mass spectrum happens.

Think of the atoms in the CO2 gas from my sample as a bunch of racecars exiting the straightaway and starting around the curve on the racetrack. Only these racecars vary in weights. And the race organizers have greased the track at the curve so that they fling into the sides of the track when they try to turn. As the racecars fling into the sides of the track, they will separate according to their mass. The lighter cars will be able to make it further around the curve before they meet their demise because they have less inertia forcing them forward, whereas the SUVs in the race will barrel forward straight into the sides of the track. At the end, you have a spectrum of racecars poking out of the walls of the track, with SUVs first, then the coupes, then the compact cars and then the motorcycles, which almost made it around the bend, but not quite. Atoms in the mass spectrometer act the same way, and we measure how many collisions happen along each point of the bend in order to not only “weigh” the sample of gas, but also figure out how many molecules of each weight there are!

It turns out that it is quite difficult to measure the exact number of atoms of a particular isotope in gas, however. It is much more economical and feasible for the purposes of most researchers to simply compare our mass spectrum to the results from a standard. Much like there is a literal standard kilogram and standard meter in a lab somewhere in France which is used to keep track of how much mass is actually in a kilogram, there is a standard used by all researchers like me to describe our samples of carbonate.

6852716289_cca3c0a635_b
A collection of belemnite fossils from the Pee Dee formation, similar to the one used for the PDB standard. Source

The most common standard used is from a belemnite fossil from the Pee Dee formation in North Carolina. Belemnites are extinct squid-like creatures that formed an internal shell, and one of those internal shells was fossilized, unearthed by a researcher and ground up to become the reference for all other researchers following. Samples of the carbonate in its fossil had more carbon-13’s per unit mass than most other fossil specimens known.  Almost everything you measure will be “lighter” in terms of carbon, because carbon-12 is naturally so common on our planet.

Scientists needed a convenient way to put a number on this, so a simple formula was developed which would allow us to quickly communicate to each other how isotopically “heavy” or “light” a particular sample is in comparison to the Pee Dee Belemnite. The formula isn’t that important for our purposes but the units of its output are in parts per thousand, or “per mil” for short (same idea of how we shorten parts per hundred to “percent”).

The symbol for per mil is a percent sign with an extra little loop at the end: ‰. To make the shorthand complete, we also need to note that this is how much the carbon-13 to carbon-12 isotope ratio of a sample differs from the Pee Dee Belemnite. We do so, we use the Greek delta symbol (δ), commonly used in science and math to represent “difference or change from.” So a sample that has a carbon-13 to carbon-12 ratio which is 20 parts per thousand less than that of the Pee Dee Belemnite is written -20 ‰ δ13CPDB. There are other samples that can be used as well, including Standard Mean Ocean water (SMOW), and the Vienna Pee Dee Belemnite (VPDB). It’s important to note which you are using so that people know the scale of your measurement!

Phew, hopefully that didn’t confuse the hell out of you! Next time, I’ll talk about how different δ13C (and for oxygen isotopes, δ18O) can tell us different details about the life of an organism. Here’s a cute gif of a scallop as a chaser after all that science you read.

You are isotopes (Part II)

This is the second part in a series how isotopes work and how they are scientifically fascinating. Part I here

It turns out a horse is not just a horse, of course. The horse is a collection of atoms, and each of those atoms has a particular isotopic “flavor”, and the collection of isotope types in the horse tells a story.  At the end of the day, scientists are simply interested in reading and telling stories about our world. The tail….er, tale of the horse is written by myriad interacting processes in the universe which influence the horse’s stable isotope ratios.

As I mentioned last time, carbon-12 is much, much more common than carbon-13 is on our planet, due to nuclear fusion of helium-4 in the sun. there are nearly 99 carbon-12’s on earth for every carbon-13. But that’s the base ratio if you took our whole planet, put it in a blender and mixed it all up. If you measured a particular object, such as a horse, it likely does not follow that measure exactly. It has become differentiated from the global average by numerous factors which have altered the isotope ratio.

In isotopic chemistry, fractionation is our name for any process which creates a preference for a certain isotope. If chemical reactions had no bias toward any particular isotope, that 99 to 1 ratio of carbon-12 to carbon-13 would be present in literally everything including you and me. But it turns out that the biochemical dice are loaded- to make the ratio even more biased!

The enormous Rubisco enzyme. No one said photosynthesis was simple. Source: Wikipedia

Photosynthesis is the process by which plants take carbon dioxide gas in the atmosphere and “fix” it to make sugars, which they then use for food. The core enzyme responsible for this carbon fixation is called Rubisco (short for Ribulose-1,5-bisphosphate carboxylase/oxygenase). This enormous molecule is likely the most abundant enzyme on earth. And it turns out that it has a favorite flavor when it comes to the carbon it fixes into sugar.

In fact, the entire plant is discriminating against carbon-13 in several of the processes of photosynthesis. Carbon dioxide molecules diffuse more quickly into the plant’s leaves if they include the lighter carbon-12 rather than carbon-13. “Light” CO2 also dissolves more easily in the plant’s fluids. But the biggest fractionation happens when the Rubisco molecule gets hold of CO2 and breaks it. At each of these steps, the light carbon-12 is more likely to be used by the plant than its heavier siblings. There are various thermodynamic reasons for why this is the case, but the plant is essentially a sieve removing more of those heavy carbons at every step. At the end of the process, the plant is left isotopically “lighter” than the CO2 gas surrounding it that it breathes in.

Because you are what you eat, this means that you are suspiciously carbon-light, and there’s nothing you can do about it. Should have thought of that before you decided to be dependent on plants as the factory for your carbon-based molecules. Next time, we’ll talk about how we measure this, and the kinds of science that can happen once you have a nice consistent measurement to use to compare isotopic ratios between samples.

You are isotopes (Part I)

As you may well know, every element is defined by its number of protons contained the nuclei of its atoms. Hydrogen has one. Carbon has six. This is non-negotiable. But every element can be found in multiple “flavors” known as isotopes. This flavor depends on the isotope’s atomic mass, which is determined by the number of neutrons present in the nucleus of that atom. Neutrons are kind of like atomic ballast. Unlike protons, which have a positive charge, they are neutral, but they do have a mass. Different isotopes have different numbers of neutrons, determining their atomic mass but preserving its particular elemental identity (which would only change if you changed the number of protons present).

Let’s focus on carbon, an element which I think about daily, though every element has isotopes and I could pick many other examples. Hope you’re OK with that, but if not it’s my blog so deal with it. So carbon has been found or created in up to 15 flavors. A whopping 98.9% of all the carbon on Earth occurs as carbon-12 (written as 12C), which has six protons and six neutrons, adding up to an atomic mass of about 12 atomic mass units (amu). It’s the most common because it’s the product of three helium-4 isotopes fusing together, each weighing 4 amu + 4 amu + 4 amu adding to make a single carbon-12. This is a very common reaction in stars, and because you are stardust, it is also the most common flavor of carbon in you.

But we make other flavors by adding neutrons. You can make carbon-13 with six protons and seven neutrons. This is a rare flavor, accounting for almost all of the remaining 1.1% of carbon found on earth. It is also the only other stable form of carbon. I note that it’s stable because all the other 13 known flavors of carbon are unstable, and many are only known from the laboratory because they are too short-lived to be found in the environment.

It turns out that if an element’s atomic nucleus is too light, or too heavy, that element will become radioactive and decay with time, continuously firing off pieces of itself out of frustration. Carbon-14 is the most famous and common of these radioactive isotopes of carbon, and it still only makes up 1 in every million million atoms of carbon on earth. Carbon-14 fires off particles and decays into nitrogen-14 because it is more stable orientation for the protons and neutrons to be in, for physics reasons I won’t get into here.

Carbon-14 does this in a very predictable, methodical pattern. It’s difficult to predict when an individual carbon-14 atom will do this, but if you take any object you have just created, like a piece of pottery, for example, you can be pretty much certain that in 5,730 years, only 1/2 of the carbon-14’s will still be present. The rest decided they’d rather be nitrogen-14. This is non-negotiable and you’d best learn to accept it. But it means that we can sniff out the age of a lot of interesting mysterious objects if we know the amount of carbon-14 present in the environment (which we often do) and measure the amount present in the object today. You have some restrictions. For example, for objects that are too old, too little of the carbon-14 would be left for you to measure accurately.

Carbon-14 dating, often just called radiocarbon dating, is very useful in figuring out the ages of stuff, but I’m mostly interested in the stable isotopes of carbon. Next week I’ll talk about why that is, and what kind of questions I can answer by looking at amounts of different stable carbon isotopes in a sample. See you then!