
This is the third part of a series about isotopes and why they’re useful and interesting to scientists.
Isotopes are the flavors of elements. And because our universe is made up of atoms of elements, every object can be thought of as a delicious smoothie of flavors. Scientists like me are trying to reverse engineer those mixtures and pick out individual tastes, in order to answer questions about our world.
For example, I work with giant clams. These guys build enormous shells made of a mineral called calcium carbonate: CaCO3. That means that every molecule in a clam’s shell contains a calcium atom, a carbon and three oxygens. But as you might know from reading the previous entries in this series, not all of those atoms are the same. They are a mixture of different flavors. We have some carbon-12 and 13 in there (so named for their atomic weights), and some oxygen-16, 17 and 18. Here I’m focusing on the stable isotopes, which are not radioactive and are called “stable” because they’re not going to self-destruct. There are radioactive isotopes in there too, but I don’t use those nearly as often in my work.
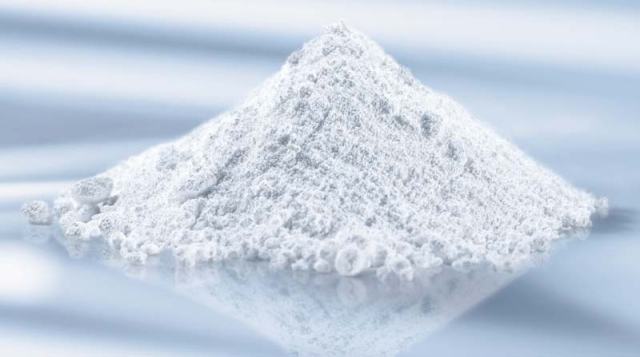
I am measuring stable isotopes of carbon and oxygen in my shell samples. To do this, I take a sample of powder, grind it up, weigh it, and put it into tiny little cups. We only need a very small sample: about 50 micrograms of shell material. A typical pill of tylenol contains over 300 mg of active ingredient, so about 6,000 of my samples will fit in a single tylenol regular strength pill, if you suddenly decided you needed a giant clam prescription.
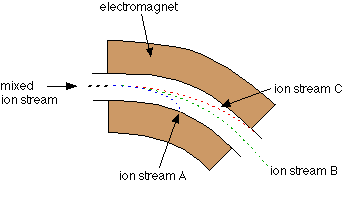
This tiny sample is one of thirty that I can measure at a time. Those samples are reacted with acid and the CO2 gas that is released as a result of the reaction can be processed by a machine called a mass spectrometer. The mass spec, which is in the Stable Isotope Laboratory in my building, ionizes the molecules in that gas (gives them a bit of electric charge) and then those ions are flung through an electromagnetic field. That beam of charged gas is flung around a curve. That curve is where the magic of making a mass spectrum happens.

Think of the atoms in the CO2 gas from my sample as a bunch of racecars exiting the straightaway and starting around the curve on the racetrack. Only these racecars vary in weights. And the race organizers have greased the track at the curve so that they fling into the sides of the track when they try to turn. As the racecars fling into the sides of the track, they will separate according to their mass. The lighter cars will be able to make it further around the curve before they meet their demise because they have less inertia forcing them forward, whereas the SUVs in the race will barrel forward straight into the sides of the track. At the end, you have a spectrum of racecars poking out of the walls of the track, with SUVs first, then the coupes, then the compact cars and then the motorcycles, which almost made it around the bend, but not quite. Atoms in the mass spectrometer act the same way, and we measure how many collisions happen along each point of the bend in order to not only “weigh” the sample of gas, but also figure out how many molecules of each weight there are!
It turns out that it is quite difficult to measure the exact number of atoms of a particular isotope in gas, however. It is much more economical and feasible for the purposes of most researchers to simply compare our mass spectrum to the results from a standard. Much like there is a literal standard kilogram and standard meter in a lab somewhere in France which is used to keep track of how much mass is actually in a kilogram, there is a standard used by all researchers like me to describe our samples of carbonate.
The most common standard used is from a belemnite fossil from the Pee Dee formation in North Carolina. Belemnites are extinct squid-like creatures that formed an internal shell, and one of those internal shells was fossilized, unearthed by a researcher and ground up to become the reference for all other researchers following. Samples of the carbonate in its fossil had more carbon-13’s per unit mass than most other fossil specimens known. Almost everything you measure will be “lighter” in terms of carbon, because carbon-12 is naturally so common on our planet.
Scientists needed a convenient way to put a number on this, so a simple formula was developed which would allow us to quickly communicate to each other how isotopically “heavy” or “light” a particular sample is in comparison to the Pee Dee Belemnite. The formula isn’t that important for our purposes but the units of its output are in parts per thousand, or “per mil” for short (same idea of how we shorten parts per hundred to “percent”).
The symbol for per mil is a percent sign with an extra little loop at the end: ‰. To make the shorthand complete, we also need to note that this is how much the carbon-13 to carbon-12 isotope ratio of a sample differs from the Pee Dee Belemnite. We do so, we use the Greek delta symbol (δ), commonly used in science and math to represent “difference or change from.” So a sample that has a carbon-13 to carbon-12 ratio which is 20 parts per thousand less than that of the Pee Dee Belemnite is written -20 ‰ δ13CPDB. There are other samples that can be used as well, including Standard Mean Ocean water (SMOW), and the Vienna Pee Dee Belemnite (VPDB). It’s important to note which you are using so that people know the scale of your measurement!
Phew, hopefully that didn’t confuse the hell out of you! Next time, I’ll talk about how different δ13C (and for oxygen isotopes, δ18O) can tell us different details about the life of an organism. Here’s a cute gif of a scallop as a chaser after all that science you read.


